10.8 Pump speed power consumption
Pump speed power consumption
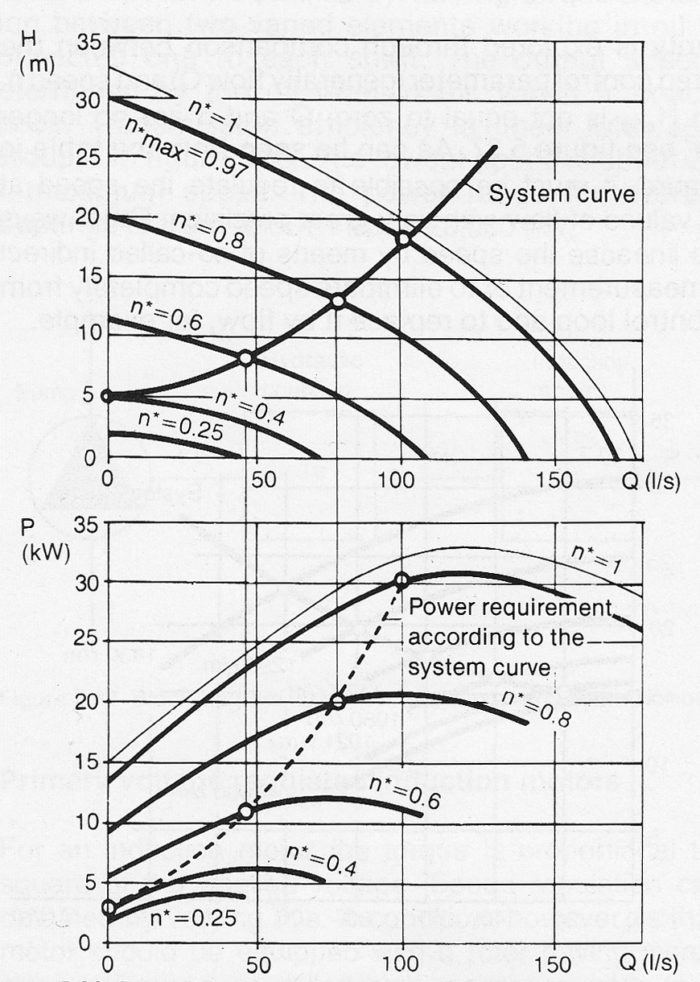
Pump speed power consumption relationship is determined by the affinity laws. In operation, the performance of a speed regulated pump follows the requirement of the system curve in the Q-H diagram.

Figure 10.8a Examples of performance curves for a speed regulated pump. The power requirement is for a pump with hydro dynamic coupling. The speed is expressed relative to maximum speed for a constant speed pump = n* = 1. Because of slip in the hydraulic coupling, even at maximum load, n*max = 0.97 which results in a slightly lower pump curve compared to an equivalent constant speed pump.
By transferring the intersection points of the system curve with the various pump curves on the Q-H diagram to the power diagram the dotted line curve in figure 10.8a is obtained. This curve comprises the power requirement when operating along the system curve.
The energy consumption PE in kWh/year will be the power multiplied by time, or
PE = PMean * tO (Equ. 10.8a)
where
PE = annual energy consumption (kWh/year)
PMean = mean power during operational time (kW)
tO = operational time per year (h/year)
The mean power is most simply determined by the use of Simpson’s integration formula :

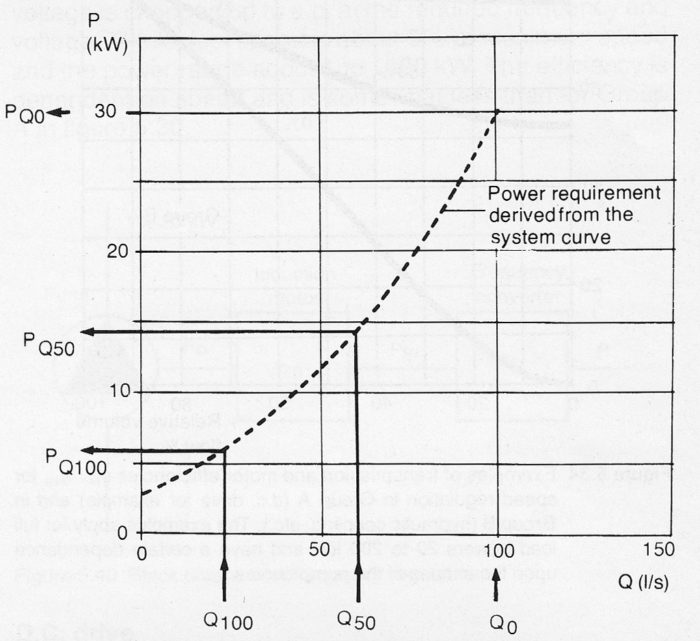
where PQ100, PQ50, PQO are the values for power requirement read off the system curve at volume flow Q100, Q50, QO respectively, i.e the flow at 100%, 50% and 10% constancy, see also figure 10.8b.

Figure 10.8b Power requirement for speed regulated centrifugal pump in accordance with figure 10.8a. Read-off at various values of Q provides the basis for determination of mean power in accordance with equation 10.8b.
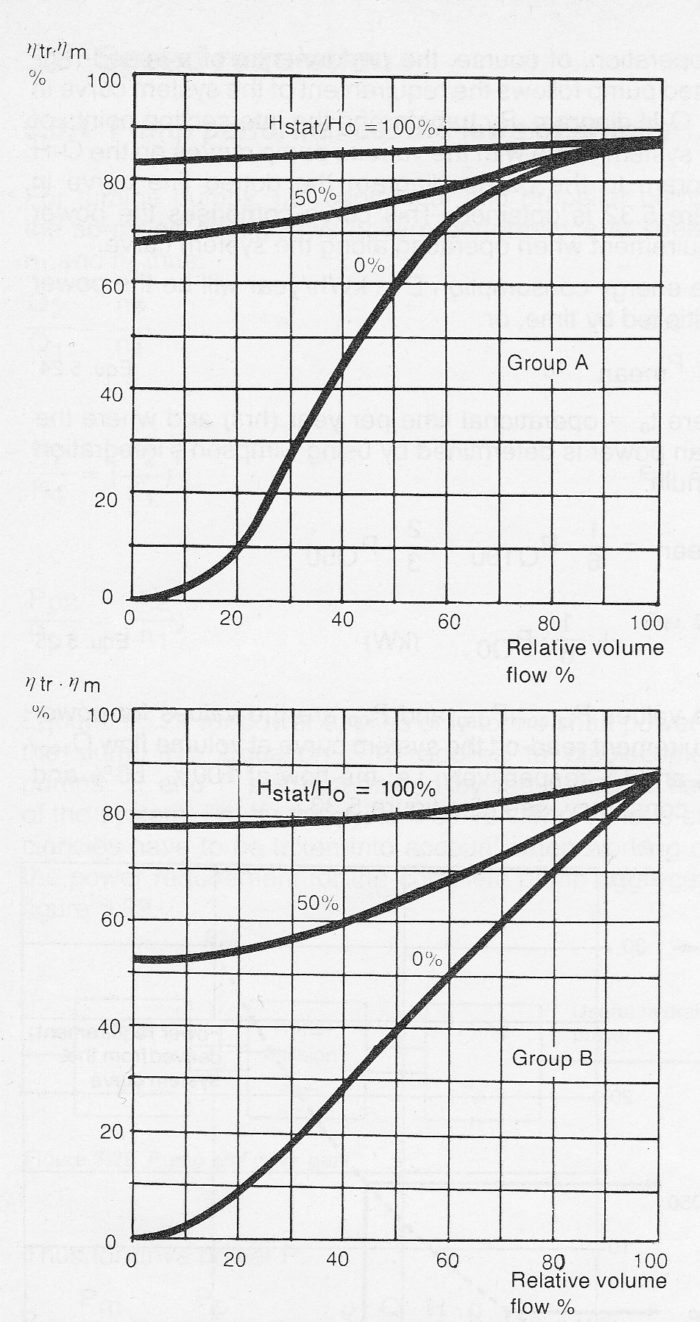
In speed regulation, the regulation efficiency is always equal to one. The losses in speed regulation are instead described by a transmission efficiency ηtr see also figures 10.7a and 10.7b from section 10.7 Pump speed>>> . The variations in pump speed and also transmission efficiency will depend upon the shape of the system curve. In some methods of drive, d.c. operation for example, transmission efficiency cannot be expressed separately but will also include motor efficiency Figure 10.8c shows how ηtr * ηm varies for group A (as in d.c. operation or frequency regulation) and for group B (hydrau lic coupling, for example).
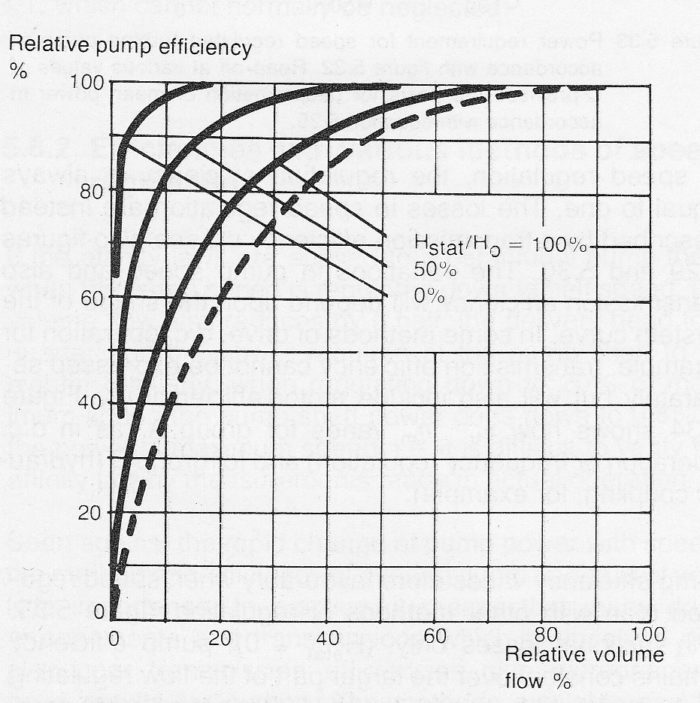
Pump efficiency varies more favorably when speed regulated than with other methods of regulation, figure 10.8d. With frictional losses only, (Hstat = 0), pump efficiency remains constant over the larger part of the flow regulating range. It should be noted, that if Hstat is not equal to zero, then better part-load efficiencies are obtained if the operational point of the pump at full load lies to the right of the flow with best efficiency.

Figure 10.8c Examples of transmission and motor efficiencies ηtr * ηm for speed regulation in Group A (d.c_ drive for example) and in Group B (hydraulic coupling, etc.). The examples apply for full load powers 20 to 200 kW and have a certain dependence upon the shapes of the pump curves.

Figure 10.8d Example of pump efficiency variation with the system curve Hstat/HO for a speed regulated centrifugal pump. The dotted curve represents the ‘”normal” efficiency curve for a constant speed pump.
