9.1 Pump system curve
Pump system curve
Pump system curve is sometimes also refereed to as System resistance curve. The difference between the two is however important to understand. The pump-system curve consist of static head, pressure head and head loss. Head loss is the resistance in pipes, valves, heat exchangers etc., thus, head loss can be refereed to as the “resistance”. Unless noted, the system resistant curve should be considered a resistant curve not including the static head (or the static pressure) components. The resistance in pipes and components will increase with increased flow, therefore the resistance in a system can be described with a curve with head loss at different flow. Note that the curve inclination will be consistent as long as nothing change within the system.
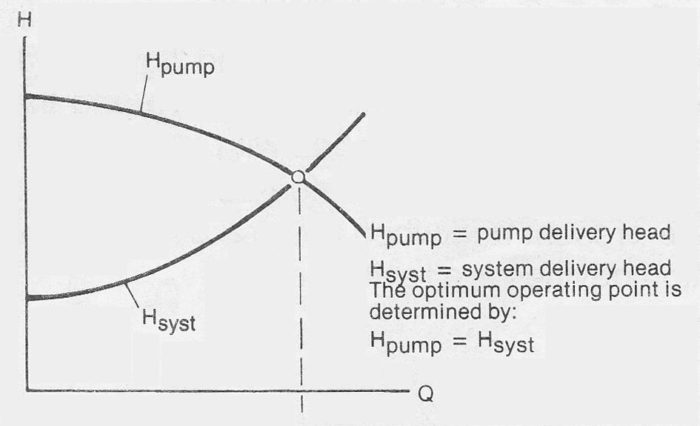
When connected in a pipe system a pump will operate at a point of equilibrium between the pump and the pipe system. At the point of equilibrium the driving function of the pump is equal in magnitude to the resistance in the system. The pump characteristics in this respect are usually represented by the Q-H curve. The equivalent curve for the pipe system is called the system curve and is designated Hsyst.

Figure 9.1a Pump optimum operating point
The volume flow at which the pump and system curves intersect each other, is the flow which will pass through the pipe system. In order to correctly determine the size and dimensions of the pump and pipe system a knowledge of the characteristics of their respective curves is necessary. This section deals With the characteristics of the pipework system.
Figure 9.1a shows typical curves for a centrifugal pump with a low specific speed (radial pump) when pumping a water like liquid. The curves vary in shape when pumping other liquids and when using other types of pumps. Generally, however, the flow is always determined by the balance between the pump and system.
Single pipe system

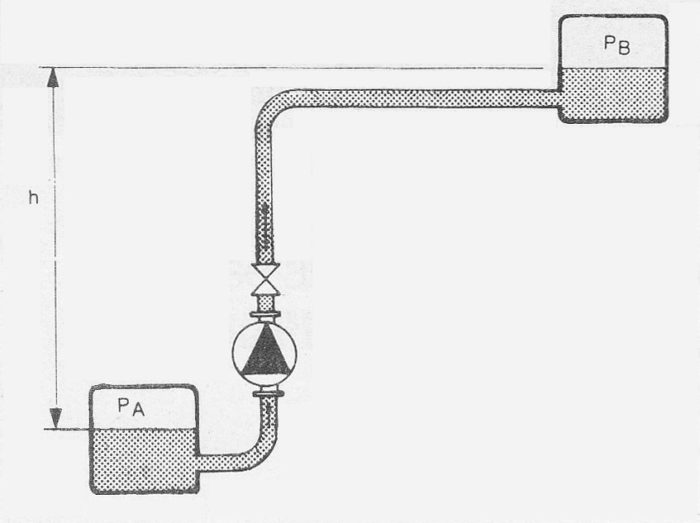
Figure 9.1b Example of single pipe system
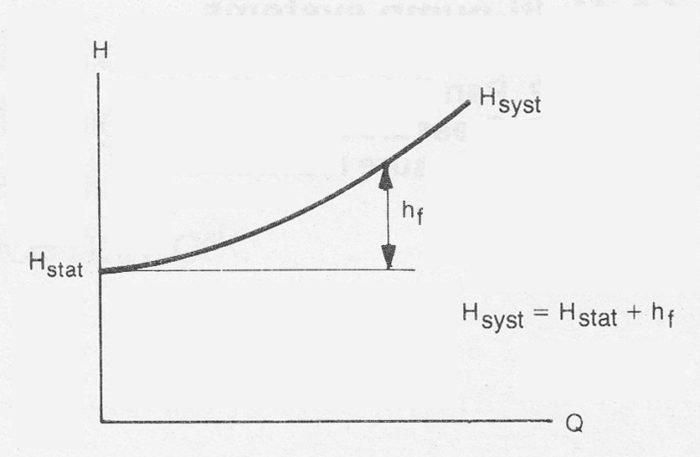
The system delivery head is usually divided into a static component Hstat and a loss component hL(head loss).
Hsyst = Hstat + hL (Equ. 9a)
The static component, which is assumed to be independent of volume flow, comprises of the difference in static pressures and the level differences between the boundaries of the system. Using the designation as in figure 9.1b:

P = static pressure (N/m²)
ρ = density of liquid (kg/m³)
g = acceleration of gravity 9,086 (m/s²)
h = level difference (m)
The losses include flow losses in pipe and other components . The following formula applies to head losses for flow in a straight pipe using the Darcy Weisbach method:

hL = head loss (m)
λ = loss coefficient
l = length of pipe (m)
d = diameter of pipe (m)
v = flow velocity (m/s)
For more information on how to calculate head loss see Chapter 8.6 >>>
For a given pipework system (l, d) With water-like liquids the loss coefficients λ and ζ are often (large Re) independent of Q. The loss of head then becomes:
hL = constant * Q²
The pressures at the system boundaries are such that PA = PB = atmospheric pressure. So that Hstat equals the level difference (h), the system delivery head then becomes:
Hsyst = Hstat + hL = h + constant * Q²
or graphically

Note that the system curve represented in figure 9.1c assumes that PA, PB and h are independent of the volume flow Q. lt is also assumed that λ and ζ are independent of Q (Re). These conditions are often, but not always, fulfilled.
Figure 9.1d shows three different pipework systems having the same level differences and therefore the same static head.

For certain piping systems, circulating systems for example, Hstat = 0 and the head of the system consists entirely of pipe flow losses.
Figure 9.1e Piping system where Hstat = 0

For other piping systems with short pipes and considerable pressure or level differences the flow losses are negligible and Hsyst = Hstat.
Figure 9.1f Piping system where hL= 0

When developing the system curve the flow losses are calculated according to Chapter 8, Liquid flow >>>.
Variable system curves
Certain conditions can cause the pump system curve to vary according to the operating situation. Some examples of such situations are given below.

Figure 9.1g Static head at start and during continuous operation.
When starting-up, the pipelines are filled with air. The pump must lift the liquid to the highest point in the line. The static delivery head reduces when the line is completely filled with liquid. If the pump’s delivery head at the zero discharge point (shut-off head) does not exceed Hstat at the start then pumping cannot begin.

Figure 9.1h System curve with varying static head.
For installations similar to figure 9.1h the static head varies as the level difference between the liquid surfaces in the vessel changes. Similar system curve changes occur in enclosed vessels, in which the pressure is dependent upon the operational situation.
The system curve’s loss component can also vary according to the operational situation. The most usual case being when rust or other deposits begin to build up in a pipeline after a period of operation. This causes an increase of flow resistance in the pipeline which results in a steeper system curve. Other examples of varying loss curves are temperature variations (viscosity, Reynolds Number), concentration variations in the case of suspensions, dosage variations etc.
An intentional change to the system curve is brought about by throttle-regulation, see Chapter 10, Flow regulation. The pump Q-H curve is also affected by viscosity and wear for example, see Chapter 3, Pumps >>>.
The relevance of the system curve to operational situations can be illustrated by some examples:

Figure 9.1i Consequences of incorrectly calculated pipe losses.
The above pump installation has been designed, to be on the “safe side”, the pipe losses having been estimated too high. The actual system curve results in a larger flow than calculated for, which means greater pump power requirement and reduced efficiency. This situation gives rise to the risk of pump overload and cavitation. The desired flow can be maintained by introducing a flow resistance into the piping system.
Figure 9.1j illustrates the reduction of pump flow caused by the build up of deposits in the pipeline. Since the size of pump has been chosen in order to obtain optimum efficiency for operation with new pipes, the subsequent flow reduction results in reduced pump efficiency.

Figure 9.1j The effect of deposits (scale, rust etc.) on pipelines.
The pump in figure 9.1k has been chosen to suit a particular operational situation, which is equivalent to Hstat Max, i.e. when the liquid levels in the lower and upper vessels are lowest and highest respectively.

Figure 9.1k The effect of varying tank vessel levels.
